 系庆专栏
系庆专栏
信息中心


近日, 复旦大学左光正研究团队在有机热电材料的电荷传输机制研究方面取得重要进展。研究发现,有机热电性能受限的普适物理机制,我们被“软库仑能隙(Soft Coulomb gap)”悄悄限制了性能上限。相关成果以“Universal Soft Coulomb Gap Governs Thermoelectric Performance in Doped Conjugated Polymers”为题,发表在能源材料领域权威期刊 ACS Energy Letters。该论文第一作者为博士生刘宇骞,通讯作者为左光正青年研究员, 合作单位包括山东大学张茂杰教授和海德堡大学的Kemerink教授团队。
01|热电性能为什么“卡脖子”?答案来自一个隐藏的能隙
过去十年,有机热电材料(OTE)在柔性能源领域迅速崛起,但功率因子 PF = σS²似乎始终徘徊在一个上限附近,难以突破。其σ(电导率)与 S(塞贝克系数)之间存在“此消彼长”的关系,却一直不知道:究竟是什么机制决定了 PF 的真正极限?研究团队在超过十种多类型共轭聚合物上做了系统实验与蒙特卡洛计算(kMC)模拟,最终揭示了一个关键现象:当掺杂浓度增加到接近 PF 最大值时,材料内部会形成一个“软库仑能隙”,导致 S急剧下降。而这正是 PF 无法继续提升的根源。
02|一个规律竟适用于所有材料:从 Mott 跃迁到 ES 跃迁的“转折点”就是 PF 峰值
研究发现,这些材料的 S–σ 曲线呈现一个跨材料普适的转变:
低掺杂区:遵循Mott 可变程跃迁(Mott-VRH),表现为 S∝σ-1/4
达到 PF 峰值后:输运机制转变为 Efros-Shklovskii 跃迁(ES-VRH),表现为 S∝ ln(σ)
关键是:Mott → ES 的跃迁点,就是 PF 达到最大值的位置。这意味着:只要形成了软库仑能隙,PF 就开始下降。要想提升性能,就必须“推迟”这个能隙出现。
03|能隙是怎么来的?载流子之间的排斥“挤”出了一个坑
kMC 模拟表明:当载流子与离化掺杂剂之间的库仑相互作用被有效屏蔽后,体系态密度(DOS)被重整化为近似高斯形状,载流子呈现准自由输运特征。继续掺杂时,一个“抛物线形的凹陷(软库仑能隙)”突然出现,这是由于载流子间长程库仑排斥增强所致。
04|瓶颈怎么破?统一的物理框架和可操作的设计策略
为了对抗这个“限制性能的能隙”,论文指出两个直接可应用的设计策略:1. 提高介电常数以增强静电屏蔽:可通过极性侧链、离子交换等手段降低载流子间的排斥强度,从而抑制或推迟软库仑能隙形成。2. 增强电荷离域性以增大有效载流子分离距离:如主链平面化、扩展共轭程度等。两者都能把“PF 下降点”推向更高电导率,可延缓能隙出现并进一步提升 PF。这两类策略均在模拟与实验中得到验证,为未来高性能有机热电材料的发展提供了清晰方向。与此同时,研究人员建立了掺杂引起的态密度(DOS) 演化及其对 S–σ关系的影响的统一理论框架。此外,研究指出软库仑能隙是高掺杂有机半导体中的普遍特征,对掺杂的OLED、OFET 等有机电子器件同样具有重要指导意义。
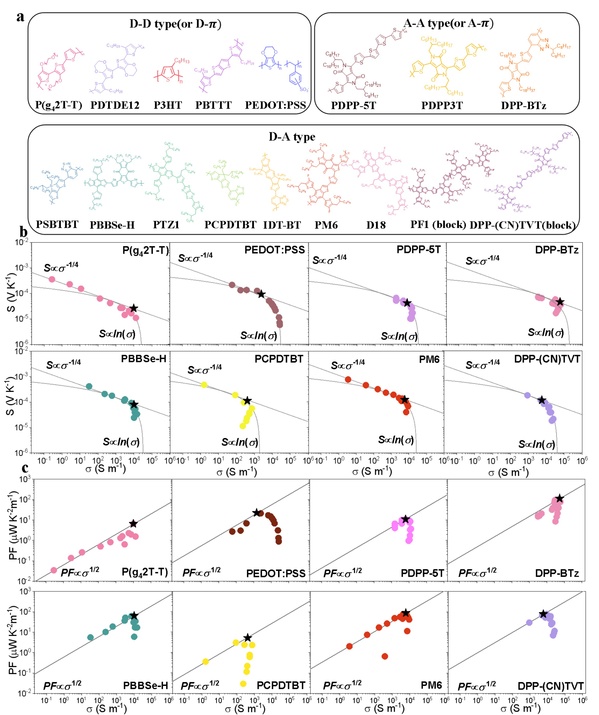
图1. 本论文研究材料的结构及其 S–σ 与 PF–σ 关系曲线
Figure 1. (a) Chemical structure of the studied materials in this work, representing diverse backbone designs including donor–donor, donor–acceptor, acceptor–acceptor, and copolymer architectures.(b) Experimental Seebeck coefficient-conductivity (S-σ) curves and (c) Corresponding power factor (PF) as a function of conductivity for representative polymersunder p-type doping conditions. P(g42T-T), PEDOT:PSS, PDPP-5T, DPP-BTz, PBBSe-H, PCPDTBT, PM6, DPP-(CV)TVT.
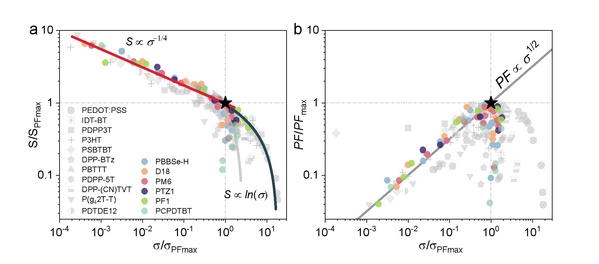
图2. 归一化 Seebeck 系数与功率因子随电导率的变化揭示热电普适性规律
Figure 2. (a)Normalized Seebeck coefficient (S/Smax) and (b) normalized power factor (PF/PFmax)as a function of conductivity (σ/σmax) for all studied polymers. Both the Seebeck coefficient (S) and conductivity (σ) are normalized to their respective values at maximum power factor. The star symbol represents the maximum PF (PFmax) All data are derived from the measurements presented in Figure 1.Solid lines are trend lines following the indicated functional form.
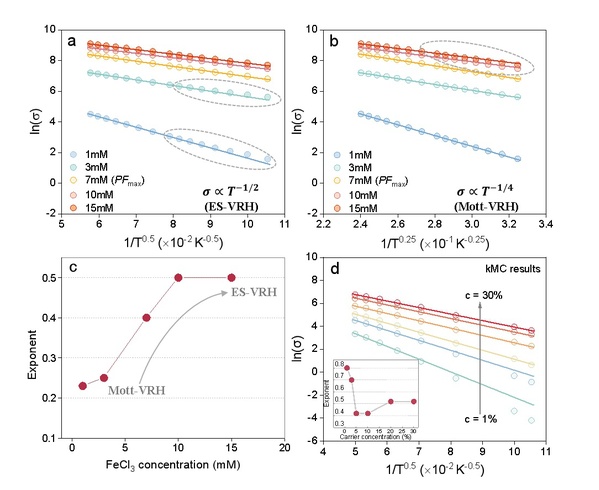
图3. 温度依赖电导率揭示 Mott-VRH→ES-VRH 跃迁
Figure 3. Temperature-dependent conductivity in experiments and simulations.(a-b) Experimental plots of logarithmic conductivity as a function of temperaturefor material PBBSe-H at different FeCl3 concentration, showing characteristic temperature exponent 0.5 and 0.25, respectively. (c) Extracted optimal hopping exponent as a function of FeCl₃ concentration, indicating a clear transition from Mott-VRH (α~0.25) to ES-VRH (α~0.5) transport with increasing doping level. (d) Kinetic Monte Carlo (kMC) calculations of logarithmic conductivity as a function of temperature at differenthole concentration.Default kMC parameters: inter-site distance aNN = 1.8 nm, energetic disorder σDOS= 75meV, attempt-to-hop frequency ν0= 1×10¹³ s-1, relativedielectric constant εr =3.6, temperature from 100 K to 400K. Lines are fits to ln(σ)∝T-0.5. Circles in panels (a) and (b) highlight nonlinear fits corresponding to Mott-VRH and ES-VRH regimes at different doping levels.
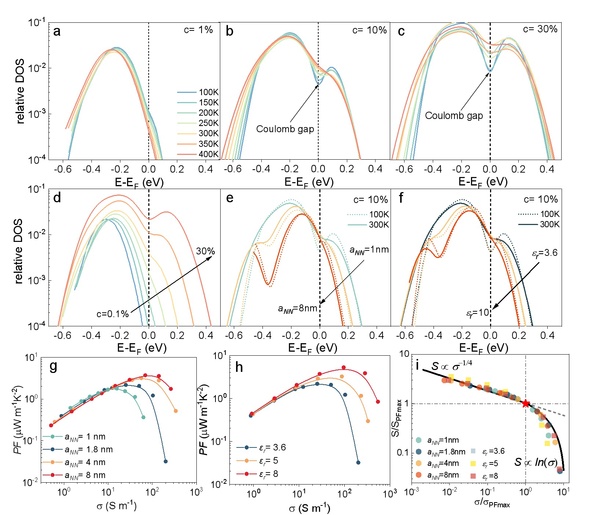
图4. 蒙特卡洛仿真模拟(kMC)揭示 DOS 与热电行为的多维演化
Figure 4.Kinetic Monte Carlo simulations of density of states (DOS) and thermoelectric behavior. (a-c) kMC-calculated evolution of the DOS as a function of temperature at different hole concentrations: (a) 1%, (b) 10% and (c) 30%. (d) DOS evolution as a function of hole concentration (1% to 30%) at 300 K. (e) DOS evolution as a function inter-site distance () ranging from 1nm to 8 nm, simulated at 100 K and 300 K. (f) Evolution of DOS as a function of relativedielectric constant () from 3.6 to 8 nm, simulated at 100 K and 300 K. (g-h) Thermoelectric characteristics from kMC simulations at varying parameters for (g) aNN=1 nm, 1.8 nm, 4 nm and 8 nm; and (h) εr= 3.6, 5 and 8. (i) Normalized Seebeck coefficient versus conductivity based on the simulation results in panels (g) and (h).Default kMCsimulation parameters(unless otherwise specified): aNN = 1.8 nm, σDOS= 75meV,ν0 = 1×10¹³ s-1,εr =3.6, from 100 K to 400K. For DOS calculations in (a-c), the same input parameters as in Figure 3d were used.
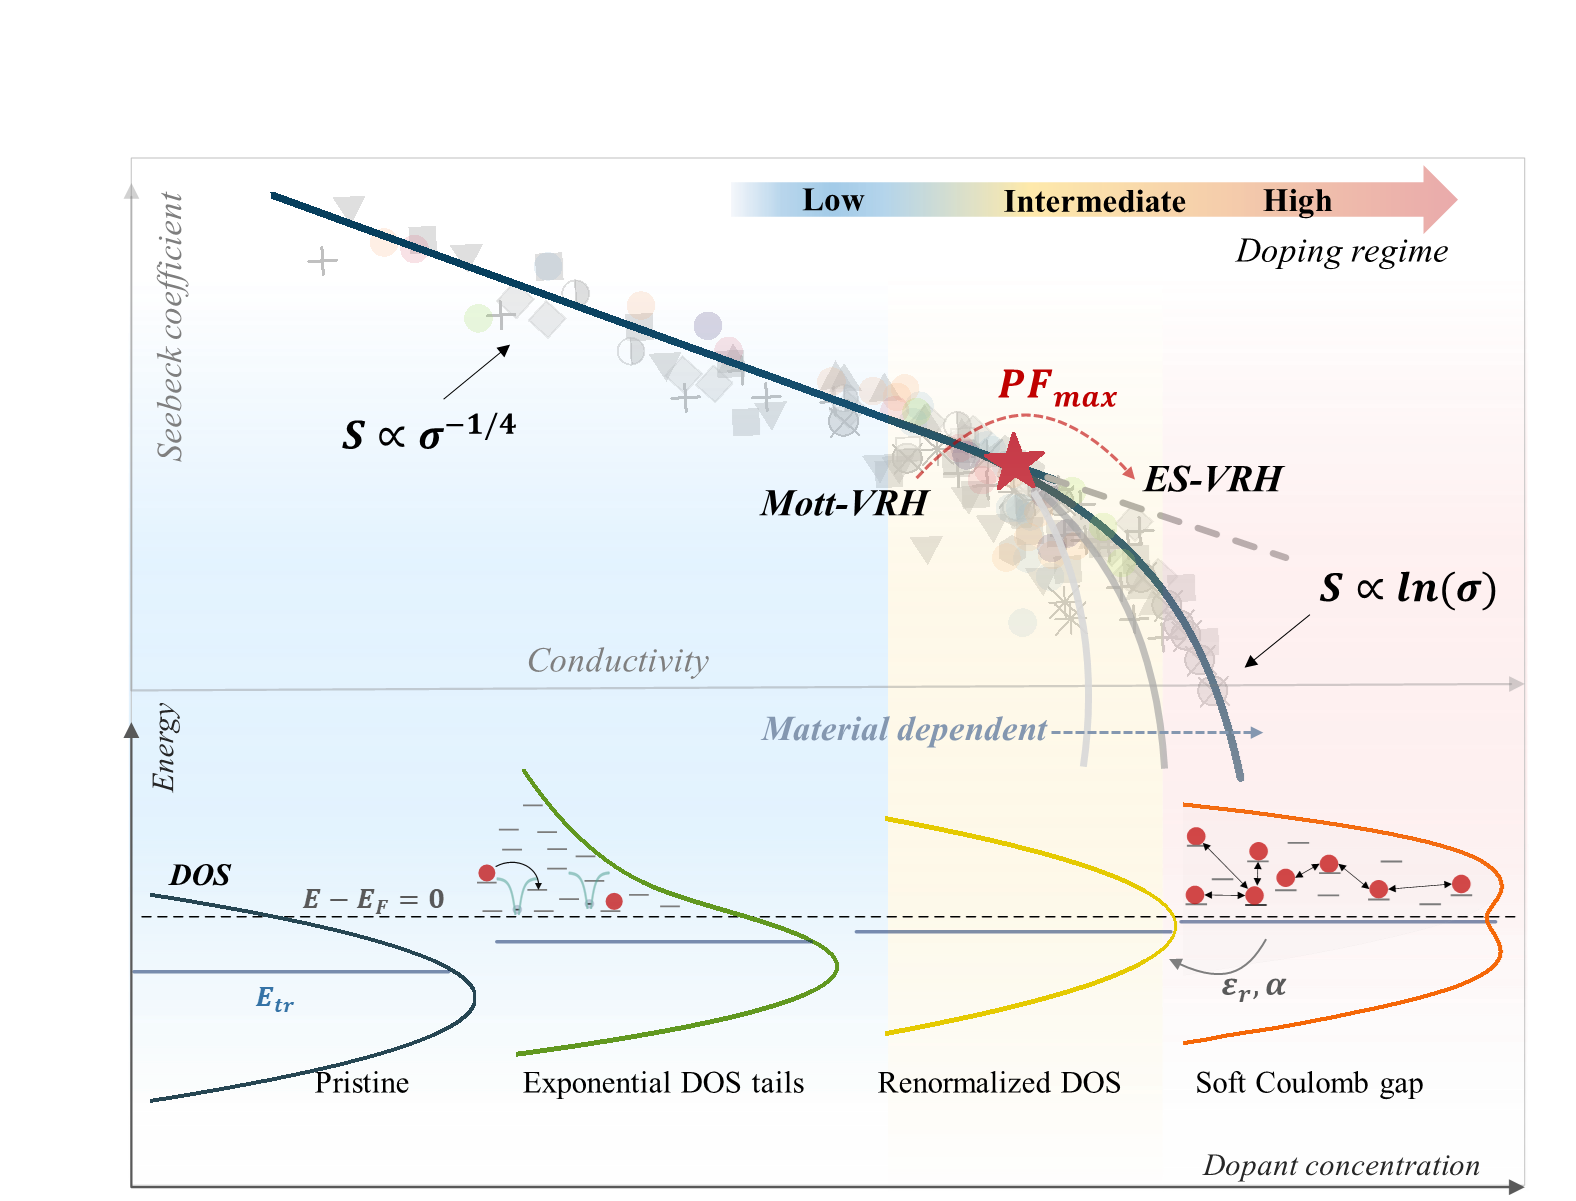
图5. 掺杂引起的态密度(DOS) 演化及其对 S–σ关系的影响的统一理论框架
Figure 5. Doping-driven evolution of the density of states (DOS) and its impact on the Seebeck-conductivity (S-σ) correlation. As doping concentration increases, the DOS progressively evolves from an intrinsic Gaussian distribution to the formation of exponential tails, then transitions into a renormalized DOS, and ultimately develops into a Coulomb-gap feature. This DOS transformation is directly reflected in the corresponding S-σcorrelation. The shaded symbols indicate the experimental data presented in Figure 2.
文章信息:
Yuqian Liu, Xiaoran Wei, Dorothea Scheunemann, Maojie Zhang, Wanlu Zhang, Martijn Kemerink and Guangzheng Zuo*. Universal Soft Coulomb Gap Governs Thermoelectric Performance in Doped Conjugated Polymers. ACS Energy Letters, 2025, 10, 6318-6326.
原文链接:https://doi.org/10.1021/acsenergylett.5c03040
Copyright © 2024 复旦大学光源与照明工程系版权所有 沪ICP备:16018209号-1沪公网安备31009102000052
 地址:上海市杨浦区淞沪路2005号
 邮编:200438
 电话:(86)021-31242633
 内部登陆
内部登陆